

Fortune Teller
P.T. Barnum is often credited with coining the phrase, “There’s a sucker born every minute.” History buffs argue the famed circus founder instead stated, “There’s a customer born every minute.” However, for investors subscribing to market-timing services, the words “sucker” and “customer” are virtually interchangeable.
Time Pickers or market timers claim the ability to predict the future movement of the stock market, moving into the market before it goes up and getting out before it goes down. However, numerous studies from industry and academic experts demonstrate market timers have no such ability to beat the market, and they should be avoided just like the lion’s cage at Barnum’s circus. According to Eugene Fama, “Market timing is a flimsy, dangerous occupation.”1
How often does a market-timing guru need to be right to beat an index? Nobel Laureate William Sharpe set out to answer that very question in his 1975 study titled, “Likely Gains from Market Timing.”2 Sharpe wanted to identify the percentage of time a market timer would need to be accurate to break even relative to a benchmark portfolio. He concluded a market timer must be accurate 74% of the time in order to outperform a passive portfolio at a comparable level of risk. In 1992, SEI Corporation updated Sharpe’s study to include the average 9.4% stock market return from the period 1901-1990. This study determined that gurus must be right at least 69% and as high as 91% of the time.3
What percentage of times do market timing gurus get it right? CXO Advisory Group tracks public forecasts of self-proclaimed market-timing gurus and rates their accuracy by assigning grades as “correct,” “incorrect” or “indecisive.” Figure 4-1 depicts CXO’s percentage grades for 28 well-known market-timing gurus who made a collective 4,629 forecasts from 2000 - 2012. The study shows that not one of the self-proclaimed gurus was able to meet Sharpe’s requirement of 74% accuracy, or SEI’s minimum 69%, thereby failing to deliver accuracy sufficient to beat a simple index portfolio.4
At first glance, the 10 gurus who had percentage accuracy of more than 50% might look appealing. But beware, the opportunity costs associated with being in cash before markets rise creates a higher hurdle that can only be made up by being in cash before markets go down. Transaction costs, taxes and mistakes associated with market timing add hurdles for market timers to just break even.
In The Big Investment Lie,5 Michael Edesess explains why market timing is so difficult, “The stock market can turn on a dime and always does. Prices are constantly twisting and turning without trend or predictable pattern. Their recent movement gives you nothing to go on.”
Figure 4-1(permalink)
A study by University of Utah Professor John Graham and Duke University Professor Campbell Harvey is titled, “Market Timing Ability and Volatility Implied in Investment Newsletters’ Asset Allocation Recommendations.”6 The massive 51-page study tracked 15,000 predictions made by 237 market-timing newsletters from June 1980 to December 1992. By the end of the period, 94.5% of the timing newsletters had gone out of business with an average life span of just four years. “There is no evidence that newsletters can time the market,” the study concluded. “Consistent with mutual fund studies, ‘winners’ rarely win again and ‘losers’ often lose again.”
“Sure, it’d be great to get out of stocks at the high and jump back in at the low,” observed John Bogle in an interview with Money Magazine.7 “[But] in 55 years in the business, I not only have never met anybody who knew how to do it, I’ve never met anybody who had met anybody who knew how to do it.”
Almost all big stock market gains and drops are concentrated in just a few trading days each year. Missing only a few days can have a dramatic impact on returns. Figure 4-2 illustrates how an investor who hypothetically remained invested in the S&P 500 Index throughout the 20-year period from 1998 to 2017 (5,036 trading days) would have earned a sizable 7.20% annualized return, growing a $10,000 investment to $40,135. When the five best-performing days in that time period were missed, the annualized return shrank to 5.02%, with $10,000 growing to $16,625, and if an investor missed the 20 days with the largest gains, the returns were cut down to just 1.15%. If the 40 best-performing days were missed, an investment in the S&P 500 turned negative, with $10,000 eroding in value to just $5,670, a loss of $4,330.
Figure 4-2(permalink)
Many market timers want to miss the worst-performing days, an even bigger issue than the problem of missing the best days. The predicament, however, is that the worst days are equally concentrated and just as difficult to identify in advance as the best days. If someone could have avoided the worst days, they would have obtained true guru status. Figure 4-3 illustrates the value of missing the worst-performing days in the 20-year period from 1998 to 2017. If the 40 worst-performing days of the S&P 500 Index were missed, an investor’s increased return would have been 952% more than investors who stayed in the market every day throughout the entire 20 years. The problem, however, is finding the crystal ball that can forecast the 40 worst performing days out of 5,036 days. This shows how market timing can be tempting and alluring.
Figure 4-3(permalink)
University of Michigan Professor H. Nejat Seyhun analyzed 7,802 trading days for the 31 years from 1963 to 1993 and concluded that just 90 days generated 95% of all the years’ market gains — an average of just three days per year.8
The expected return of markets are positive and essentially constant. Therefore, investors who are out of the market for any period of time can expect to lose money relative to a simple low-cost and tax-efficient buy-and-hold strategy.
 Goddess Fortuna
Many investors believe market watchers have the ability to forecast future market movements, but history tells a different story. Take the first half of 2009, when many such forecasters dismissed the rise in stock prices that ensued in March 2009 as an anomoly that would soon be rectified. Only market timers who have the Goddess Fortuna or Lady Luck whispering in their ears might be able to accurately forecast the markets twists and turns.
The Goddess Fortuna offers a cornucopia of gold coins and treats, but she sits atop a bubble that floats on the ocean, reminding us how fleeting luck can be. Her flowing scarf reminds her followers their fortunes can shift in the wind.
 Devouring the News
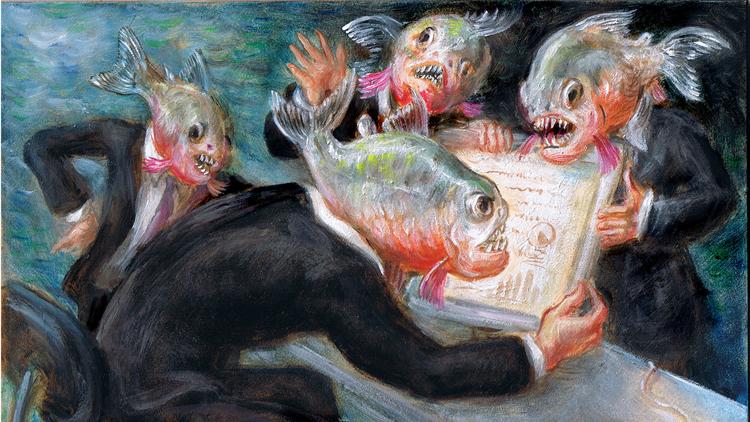
In Analysis for Financial Management,9 Robert C. Higgins describes how market participants instantly devour new information, which is the inspiration for the painting on the following pages. “The arrival of new information to a competitive market can be likened to the arrival of a lamb chop to a school of flesh-eating piranhas,” Higgins writes. “The instant the lamb chop hits the water there is turmoil as the piranhas devour the meat. Very soon, the meat is gone, leaving only the worthless bone behind, and the water returns to normal… no amount of gnawing on the bone will yield any more meat, and no further study of old information will yield any more valuable intelligence.”
A 1969 study titled, “The Adjustment of Stock Prices to New Information,”10 was conducted by Fama, Jensen et al, and concluded it takes five to 60 minutes for market prices to completely reflect new information. Given the study took place in 1969, imagine how quickly market information travels today as investors worldwide instantly get market news on their smart phones. Fund managers seek to exploit any tiny possible gain by reacting quickly to news, but the likelihood that they will consistently be on the right side of a trade is non-existent.
When discussing the direction of the market, it’s important to use the past-tense verb. During times of high market volatility, people commonly err by saying, “The market is going down or going up.” Although it appears innocuous, this statement implies that the future direction of market prices is knowable. These statements serve as the impetus for rash investment decisions. Such decisions usually do not fare well, because they are based on the fallacy that one can predict future price movements. Investors can avoid this pitfall by understanding Eugene Fama’s finding that security prices move in a random walk. At all times, we only know the current and past price of any security. Where the price will be even a second later is unknown. The market continuously sets prices in response to news, which by its nature is unpredictable. Investors will serve themselves well by being able to say “the market has gone down or has gone up” without even having to think about it.
 Market Forces
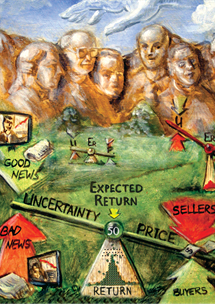
The job of free markets is to set prices so that investors are rewarded for the risks they take. To help explain this important statement, I created a model, which attempts to simplify market forces into three variables: Price, Expected Return and Uncertainty. Prices move inversely proportional to economic uncertainty so that expected returns at a specified level of risk can remain essentially constant. This implies that prices are fair all the time. From fair prices we expect fair returns, meaning that investors should be compensated for their risk exposure over a risk appropriate hold period.
The reason people invest is to get a return. At the time of a trade, buyers pay a price that reflects the risk associated with capturing the expected return. In other words, a fair price equals a fair expected return.
This model is based on Eugene Fama’s Efficient Market Hypothesis, which states that prices fully reflect all available information or news, economic uncertainty and probabilities of future events, thus implying that market prices are fair.
The model shown in the following painting attempts to diagram the three variables of Price, Expected Return and Uncertainty— resulting in a distribution of actual monthly returns shown at the bottom. The diagram shows the essentially constant expected return of a diversified investment portfolio held constant with 50% stocks and 50% bonds. Index Portfolio 50 is shown at the fulcrum of the teeter-totter, and the period- specific expected return can be estimated based on 50 or 90 years of simulated historical returns, the Fama/French Five-Factor Model, or any reasonable method an investor chooses. Current news impacts economic uncertainty and is represented on the left side of the teeter-totter. This economic uncertainty includes the probabilities of future events as estimated by the buyers and sellers. The price agreed upon by willing buyers and sellers is on the right side. Prices move inversely proportional to shifts in economic uncertainty so that expected returns remain essentially the same for a given level of risk.
From a fair price investors should expect: 1) a fair outcome, which would be a risk-appropriate or fair return; 2) an equal chance of being greater than or less than that fair return; and 3) the farther the actual return is from the expected return, the lower the probability of its occurrence.
So before you trade, ask yourself: 1) Who is on the other side of my trade? 2) Do I think I know more than they do? 3) Am I paying a fair price? In my opinion, your answers are as follows: 1) You don’t know; 2) It’s highly unlikely; and 3) If there are many willing buyers and sellers, by definition, it is a fair price.
Time pickers cannot forecast the direction of the market because they cannot know the next news story. There is no competitive edge that exists other than illegal inside information. The best way to earn the market’s fair return is to simply remain invested at all times in a relatively low-cost, passively managed index portfolio (also see hebnermodel.com).